Now that we are into the third generation of ecommerce where companies not only transact online, but do so globally and in real-time, companies are trying to squeeze more and more revenue from the traffic they have (AKA optimization).
However, not all optimization practices yield the same results and, if done incorrectly, you WILL reach the wrong conclusion.
In this post, we are going to give you some simple real-world tactics that will help improve the accuracy of your tests – thus, providing more useful results.
First of all, the goal of testing is usually to increase revenue, but can be equally used to increase click-throughs, form submissions and downloads. It all depends on what your definition of “conversion” is, so keep that in mind.
As ecommerce industry veterans, we typically define conversion rate as “the number of customers who complete a purchase divided by the total number of customers who enter the checkout process.” (For more on how conversion rates can be confusing, check out this blog post: Conversion rates: A false sense of security?)
As a side note, if you are selling products globally, you should make a decision about whether an order submitted counts the same as an order paid.
This relates to offline payments such as wire transfers, PayPal, Boleto Bancario, Konbini and others where payment is completed only after the order is completed. See our previous post about the the joys and sorrows of offline payments.
Because even the smallest changes, like button color or size can have a measurable impact on conversion rates, testing these variables is imperative to optimize your revenue.
When conducting a test, consider a scenario with two candidates — a control candidate and a challenger candidate. The control candidate is your baseline, and the challenger candidate is the modified option.
A comparison test of the two tells you whether your original is better or worse than the modified version. However, it is entirely possible to have a better conversion rate, but lower revenue.
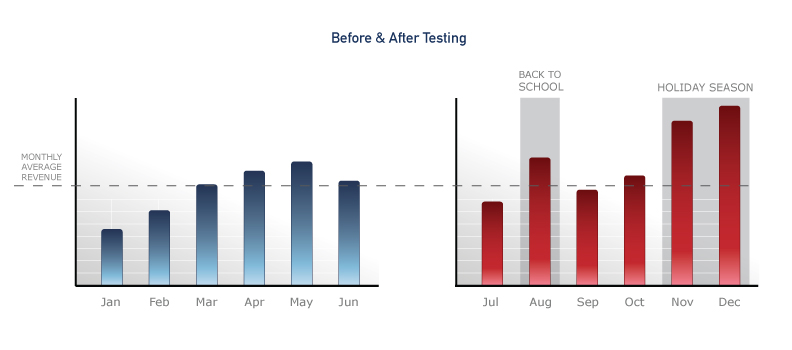
One common, yet flawed way that some companies conduct testing between their control candidate and challenger candidate is by comparing data before a change is made and after the change is made. This is a severely flawed method because changes to other factors may have a positive or negative effect on the results.
One obvious example of this is when you initiate a marketing campaign. There is invariably a spike in traffic to your site that results in a different mix of customers between the control and challenger candidates.
If your campaign went to previous customers, they are more likely to purchase an upgrade than first-time customers. Other examples are changing PPC ads, the addition or loss of affiliates and external factors outside your control.
The following graphic illustrates monthly average revenue before and after a control vs. challenger test. The challenger (in red) clearly had greater revenue than the control (in blue). Because the challenger resulted in greater revenue, you may think that it’s the better choice.
However, the external factors highlighted made the comparison between the two time periods invalid. Squeezing the time-frame down to weekly, daily or even hourly still doesn’t result in valid data when using this type of “before and after” testing methodology. Outside influences invalidate the results.
Therefore, it’s critical that you test control and challenger options at the same time. By randomly assigning traffic to each candidate, you normalize these external factors so that even if you are running an email marketing campaign, the mix of customers seeing each candidate should be the same.
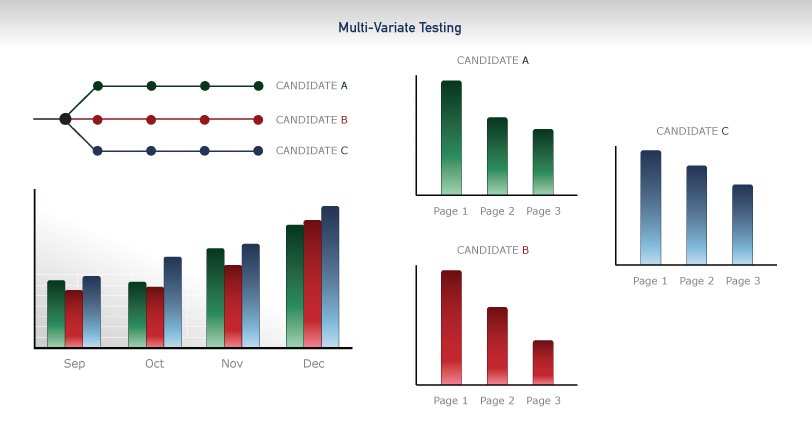
When testing things like button types, colors and other very minor items, multi-variate testing is the best testing option. Rather than having a control and a single challenger candidate, there are many challenger candidates.
In this situation, it’s important that the changes between candidates are clear enough to reach a definitive conclusion. What’s the point of running a test if the difference between the three or more candidates takes two months to determine or there’s no clear winner?
We recommend a sample size of 1,000 completed actions to reach a definitive result. What this means is that you need 1,000 successful “conversions,” however you choose to define them, to have a large enough sample to determine a winner. If the results are close, within a 5 percent difference, then you need even more samples to determine a winner.
The more candidates that you have, the less likely that 1,000 conversions yields a definitive answer, but simply let the test run longer to be sure of the result.
As you may have inferred from the earlier discussion, proper measurement is the key to any successful optimization program. If the reliability of your results is in question, all the work done to that point was a waste. Be sure of the following points before starting your optimization program:
1. Define the metric conversion rate
Squeeze the start and end points to isolate the change that you want to test.
2. Be clear about what you are testing
Identify one or two varia to test rather than lumping a bunch of things together.
3. Be patient
Wait for definitive results before making more changes or your data could be useless
Keystone
Proper MVT testing is critical to reaching valid conclusions. Running tests incorrectly or with unreliable results leads to incorrect conclusions.
What are some of your success stories when you’ve used the proper testing methodologies? What areas do you test to achieve the greatest results?

