A practical way of evaluating what changes you need to make in your online stores is through investigating the patterns of behavior of your visitors and buyers. The main thing is to look at your own data and weigh your findings against other research benchmarks. This is why it is so important to read what experts have to say about your industry. You should not follow their advice blindly, but you should analyze your performance and adjust your behavior in light of what has worked and hasn’t worked for you and for others.
This infographic from 13ten, a UK based parcel delivery company, illustrates important ecommerce data that can benefit your ecommerce performance in ways like:
- Finding out the time of day when your shoppers are most active. Does sending a promotional email work better if it’s sent while the recipient is typically at work or at home? During what time frame do most of your sales occur? What time do most of your cart abandonments take place? This information can have a positive impact on your advertising efforts through social, search and email.
- Keeping track of how online retail compares to brick-and-mortar sales is important if you are trying to convince your boss to invest in enhancing your ecommerce infrastructure. Include demographics like age, gender and location in your research and then analyze your marketing messages to see if they really correspond to your typical buyer.
- The third key practice mentioned in this infographic is finding out why people are abandoning your carts and asking for refunds. Through website optimization tests and customer satisfaction surveys, your business can uncover a treasure trove of data that should assist you in raising conversion rates and revenue.
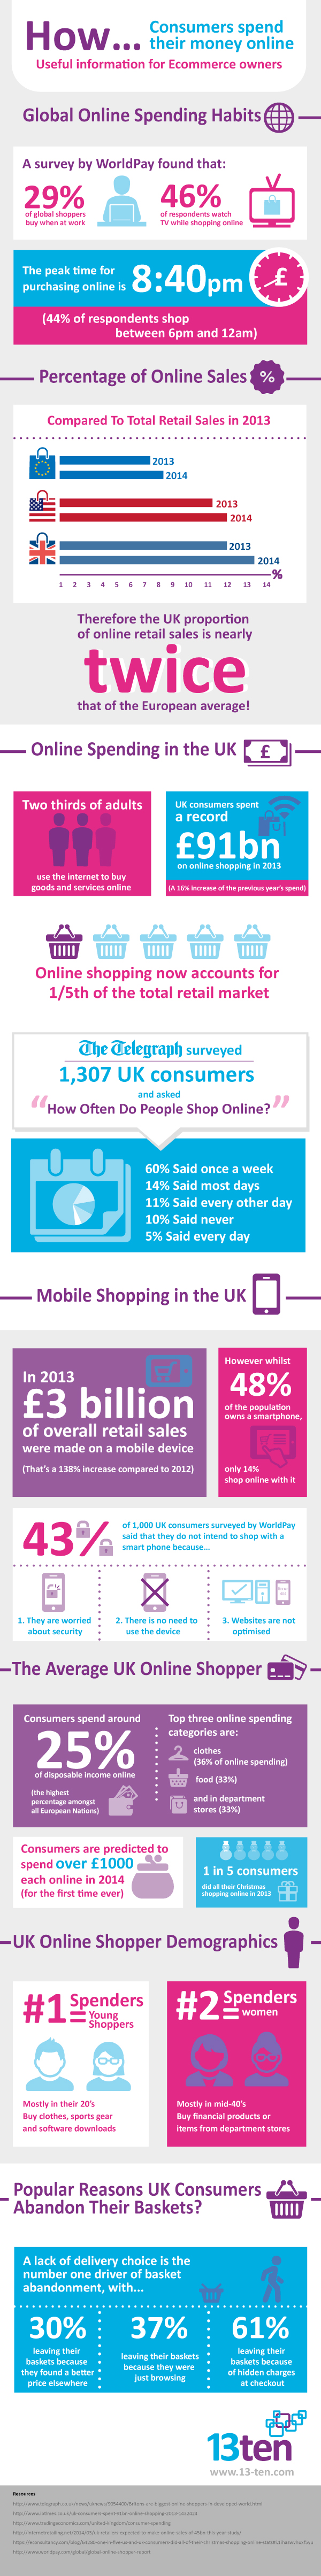
Infographic: How Consumers Spend Their Money Online
